The gross domestic product (GDP) of China in 2019 was 99,086.5 billion yuan, up by 6.1% over the previous year according to preliminary estimation of National Bureau of Statistics of China.
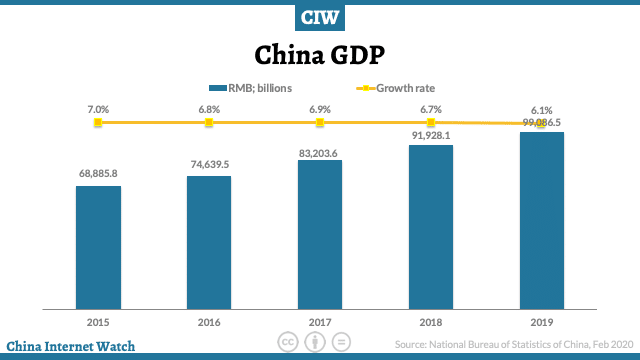
In 2019, GDP in China’s eastern areas was 51,116.1 billion yuan, an increase of 6.2% compared with the previous year; the central areas, 21,873.8 billion yuan, up by 7.3%; the western areas, 20,518.5 billion yuan, up by 6.7%; and the northeastern areas, 5,024.9 billion yuan, up by 4.5%.
In 2019, the GDP in Beijing-Tianjin-Hebei Region reached 8,458.0 billion yuan, up by 6.1% over the previous year; that in the Yangtze River Economic Belt, 45,780.5 billion yuan, up by 6.9%; and that in the Yangtze River Delta, 23,725.3 billion yuan, up by 6.4%.
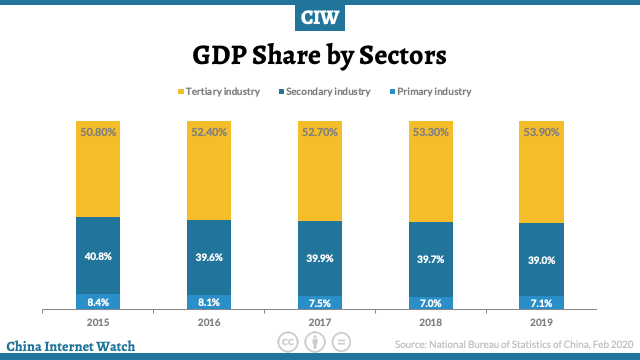
The value added of the primary industry was 7,046.7 billion yuan accounting for 7.1% of total GDP, up by 3.1%; the secondary industry was 38,616.5 billion yuan (39% of total GDP), up by 5.7%; and, the tertiary industry was 53,423.3 billion yuan (53.9%), up by 6.9%.
The contribution of the final consumption expenditure to GDP was 57.8%, that of the gross capital formation 31.2 percent and that of the net exports of goods and services 11.0 percent.
The per capita GDP in 2019 was 70,892 yuan, up by 5.7% compared with the previous year. The gross national income in 2019 was 98,845.8 billion yuan, up by 6.2% over the previous year.
CIW Premium subscribers can download the Dossier: China’s Economy in 2019
The national energy consumption per 10,000 yuan worth of GDP went down by 2.6 percent over 2018, and the overall labor productivity reached 115,009 yuan per person in 2019, up by 6.2% over the previous year.
By the end of 2019, the total number of Chinese population at the mainland reached 1,400.05 million, an increase of 4.67 million over that at the end of 2018. Of this total, urban permanent residents totaled 848.43 million, accounting for 60.60% of the total population (the urbanization rate of permanent residents), 1.02 percentage points higher than 2018.
The urbanization rate of the population with household registration was 44.38%, 1.01 percentage points higher than 2018. The year 2019 saw 14.65 million births, a crude birth rate of 10.48 per thousand, and 9.98 million deaths, a crude death rate of 7.14 per thousand.
The natural growth rate was 3.34 per thousand. The population who lived in places other than their household registration areas reached 280 million, of which 236 million were floating population.
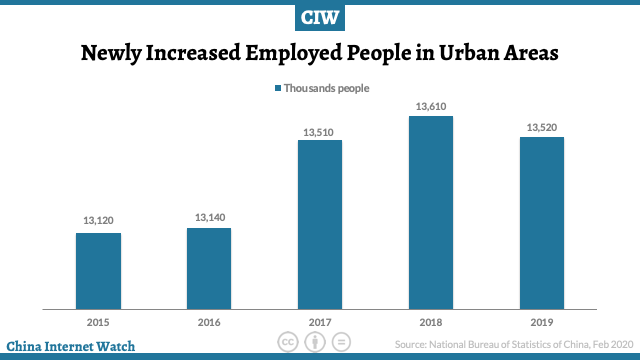
At the end of 2019, the number of employed people in China was 774.71 million, and that in urban areas was 442.47 million, accounting for 57.1%, 1.1 percentage points higher than the end of 2018.
The newly increased employed people in urban areas reached 13.52 million, 90 thousand less than the previous year. The surveyed urban unemployment rate was 5.2% at the year end, and the registered urban unemployment rate was 3.6%.
The total number of migrant workers in 2019 was 290.77 million, up by 0.8% over that of 2018. Specifically, the number of migrant workers who left their hometowns and worked in other places was 174.25 million, up by 0.9%, and those who worked in their own localities reached 116.52 million, up by 0.7%.
The consumer prices in 2019 went up by 2.9% over the previous year. The producer prices for industrial products went down by 0.3% and the purchasing prices for industrial producers down by 0.7 percent. The prices for investment in fixed assets increased by 2.6 percent. The producer prices for farm products increased by 14.5%.
In December 2019, out of the 70 large-and-medium-sized cities, 68 cities experienced a year-on-year rise in sales prices of new commercial residential buildings and two cities experienced a decline.
At the end of 2019, China’s foreign exchange reserves reached US$3,107.9 billion, an increase of US$35.2 billion compared with 2018. The average exchange rate of the year was 6.8985 RMB to 1 USD dollar, depreciated by 4.1% over that of 2018.
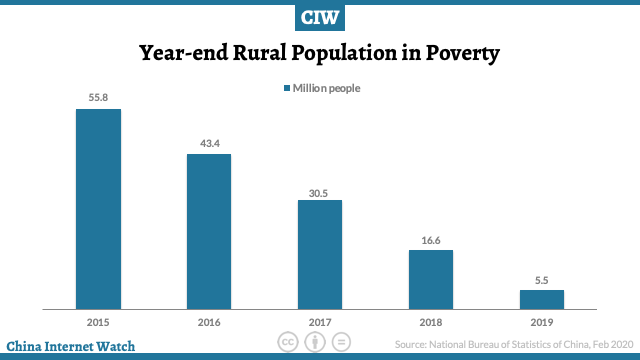
By the rural poverty line of annual per capita income of 2,300 yuan (at 2010 constant prices), the rural population living in poverty at the end of 2019 was 5.51 million, 11.09 million less compared with that at the end of 2018, and the incidence of poverty was 0.6 percent, 1.1 percentage points lower than that of the previous year.
In 2019, the per capita disposable income of rural residents in impoverished areas was 11,567 yuan, an increase of 11.5% over 2018, or a real increase of 8.0% after deducting price factors.
Industry and Construction
In 2019, the total value added of the industrial sector was 31,710.9 billion yuan, up by 5.7% over the previous year. The value added of industrial enterprises above the designated size increased by 5.7 percent.
Of the industrial enterprises above the designated size, in terms of ownership, the value added of the state-holding enterprises grew by 4.8%, that of the share-holding enterprises up by 6.8%, that of the enterprises funded by foreign investors and investors from Hong Kong, Macao, and Taiwan up by 2.0% and that of private enterprises up by 7.7%.
In terms of sectors, the value added of the mining industry was up by 5.0 percent, that of manufacturing up by 6.0 percent and that of production and supply of electricity, heat power, gas and water up by 7.0 percent.
In 2019, of the industrial enterprises above the designated size, the value added for processing of food from agricultural and sideline products was up by 1.9 percent over the previous year;
- for textile industry up by 1.3 percent;
- for manufacture of raw chemical materials and chemical products up by 4.7 percent;
- for manufacture of non-metallic mineral products up by 8.9 percent;
- for smelting and pressing of ferrous metals up by 9.9 percent;
- for manufacture of general purpose machinery up by 4.3 percent;
- for manufacture of special purpose machinery up by 6.9 percent;
- for manufacture of automobiles up by 1.8 percent;
- for manufacture of electrical machinery and apparatus up by 10.7 percent;
- for manufacture of computers, communication equipment and other electronic equipment up by 9.3 percent;
- for production and supply of electricity and heat power up by 6.5 percent
In 2019, the profits made by industrial enterprises above the designated size were 6,199.6 billion yuan, down by 3.3 percent over the previous year.
By ownership, the profits of state-holding enterprises were 1,635.6 billion yuan, down by 12.0 percent over the previous year; those of share-holding enterprises were 4,528.4 billion yuan, down by 2.9 percent; those of enterprises funded by foreign investors or investors from Hong Kong, Macao and Taiwan were 1,558.0 billion yuan, down by 3.6 percent; and those of private enterprises were 1,818.2 billion yuan, up by 2.2 percent.
In terms of different sectors, the profits of mining were 527.5 billion yuan, up by 1.7 percent over the previous year; those of manufacturing were 5,190.4 billion yuan, down by 5.2 percent; and those of the production and supply of electricity, heat power, gas and water were 481.6 billion yuan, up by 15.4 percent. In 2019, the cost for per-hundred-yuan business revenue of the industrial enterprises above the designated size was 84.08 yuan, or 0.18 yuan more than that of 2018; the profit rate of the business revenue was 5.86 percent, down by 0.43 percentage points.
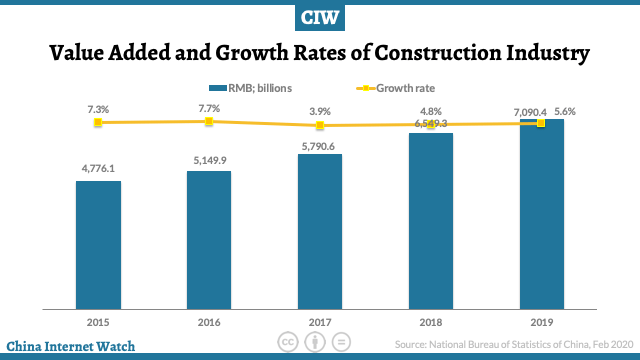
In 2019, the value added of construction enterprises in China was 7,090.4 billion yuan, up by 5.6 percent over the previous year. The profits made by construction enterprises qualified for general contracts and specialized contracts reached 838.1 billion yuan, up by 5.1 percent over the previous year, of which the profits made by state-holding enterprises were 258.5 billion yuan, up by 14.5 percent.
Service Sector
In 2019, the value added of the wholesale and retail trades was 9,584.6 billion yuan, up by 5.7 percent over the previous year; that of transport, storage and post was 4,280.2 billion yuan, up by 7.1 percent; that of hotels and catering services was 1,804.0 billion yuan, up by 6.3 percent; that of financial intermediation was 7,707.7 billion yuan, up by 7.2 percent; that of real estate was 6,963.1 billion yuan, up by 3.0 percent; that of information transmission, software and information technology services was 3,269.0 billion yuan, up by 18.7 percent; and that of leasing and business services was 3,293.3 billion yuan, up by 8.7 percent.
In 2019, the business revenue of service enterprises above the designated size grew by 9.4 percent over the previous year, and the operating profits grew by 5.4 percent.
The turnover of telecommunication services totaled 10,678.9 billion yuan, up by 62.9 percent over the previous year.
By the end of 2019, there were 1,792.38 million phone subscribers in China, 1,601.34 million of which were mobile phone subscribers. Mobile phone coverage rose to 114.4 sets per 100 persons.
The number of fixed broadband internet users reached 449.28 million, an increase of 41.90 million over the end of the previous year. Of this total, fixed fiber-optic broadband internet users amounted to 417.40 million, an increase of 49.07 million.
The mobile internet traffic in 2019 was 122.0 billion gigabytes, up by 71.6 percent over the previous year. Software revenue from software and information technology services industry in 2019 was 7,176.8 billion yuan, up by 15.4 percent over 2018.
Investment in Fixed Assets
The total investment in fixed assets of the country in 2019 was 56,087.4 billion yuan, up by 5.1 percent over the previous year.
Of the total, the investment in fixed assets (excluding rural households) was 55,147.8 billion yuan, up by 5.4 percent. By regions, the investment in eastern areas was up by 4.1 percent over the previous year, central areas up by 9.5 percent, western areas up by 5.6 percent, and northeastern areas down by 3.0 percent.
In 2019, the investment in real estate development was 13,219.4 billion yuan, up by 9.9 percent over the previous year. Of this total, the investment in residential buildings reached 9,707.1 billion yuan, an increase of 13.9 percent, that in office buildings was 616.3 billion yuan, up by 2.8 percent, and that in buildings for commercial business was 1,322.6 billion yuan, down by 6.7 percent.
China Import & Export
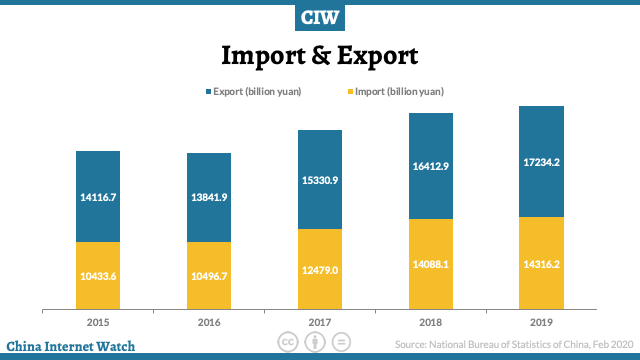
The total value of imports and exports of goods in 2019 reached 31,550.5 billion yuan, up by 3.4 percent over that of the previous year.
Of this total, the value of goods exported was 17,234.2 billion yuan, up by 5.0 percent; the value of goods imported was 14,316.2 billion yuan, up by 1.6 percent. The surplus of trade in goods reached 2,918.0 billion yuan, up by 593.2 billion yuan over that of the previous year.
The total value of imports and exports between China and countries along the Belt and Road was 9,269.0 billion yuan, an increase of 10.8 percent over that of the previous year. Of the total, the value of goods exported was 5,258.5 billion yuan, an increase of 13.2 percent; that of goods imported was 4,010.5 billion yuan, an increase of 7.9 percent.
Households Income and Consumption
In 2019, the per capita disposable income nationwide was 30,733 yuan, an increase of 8.9 percent over that of the previous year or a real increase of 5.8 percent after deducting price factors.
The median of per capita disposable income nationwide was 26,523 yuan, up by 9.0 percent.
In terms of usual residence, the per capita disposable income of urban households was 42,359 yuan, up by 7.9 percent over that of 2018, or a real growth of 5.0 percent after deducting price factors.
The median of per capita disposable income of urban households was 39,244 yuan, up by 7.8 percent.
The per capita disposable income of rural households was 16,021 yuan, up by 9.6 percent over that of the previous year, or 6.2 percent in real terms after deducting price factors. The median of per capita disposable income of rural households was 14,389 yuan, up by 10.1 percent.
Grouped by income quintile, the per capita disposable income of low-income groups reached 7,380 yuan, the lower-middle-income group 15,777 yuan, the middle-income group 25,035 yuan, the upper-middle-income group 39,230 yuan and the high-income group 76,401 yuan.
The per capita monthly income of migrant workers was 3,962 yuan, increased by 6.5 percent over that of the previous year.
Science & Technology
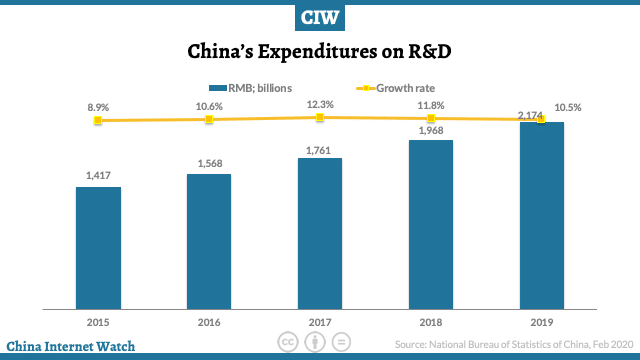
Expenditures on research and experimental development activities (R&D) were worth 2,173.7 billion yuan in 2019, up by 10.5 percent over that of 2018, accounting for 2.19 percent of GDP.
Download the Dossier: China’s Economy in 2019