
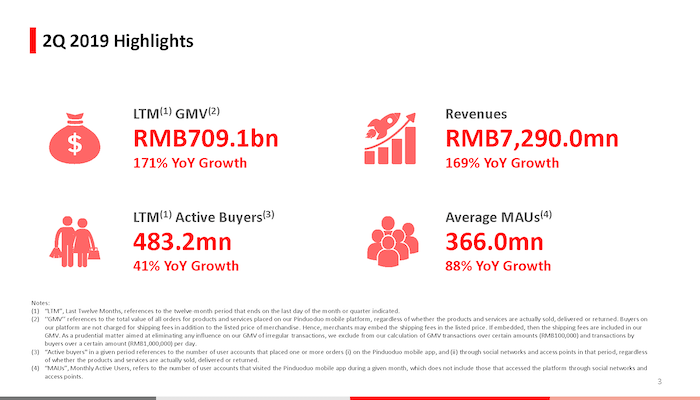
China e-commerce platform Pinduoduo reported total revenues in the second quarter of RMB7,290.0 million (US$1,061.9 million), an increase of 169% from RMB2,709.0 million in Q2 2018 according to its official announced financial results.
How is Pinduoduo a valuable e-commerce platform for top tier cities in China?
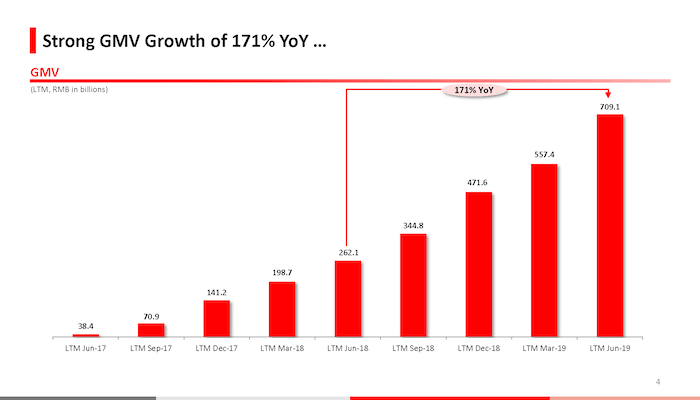
Pinduoduo’s GMV in the 12-month period ended June 30, 2019 was RMB709.1 billion (US$2103.3 billion), an increase of 171% from RMB262.1 billion in the twelve-month period ended June 30, 2018.
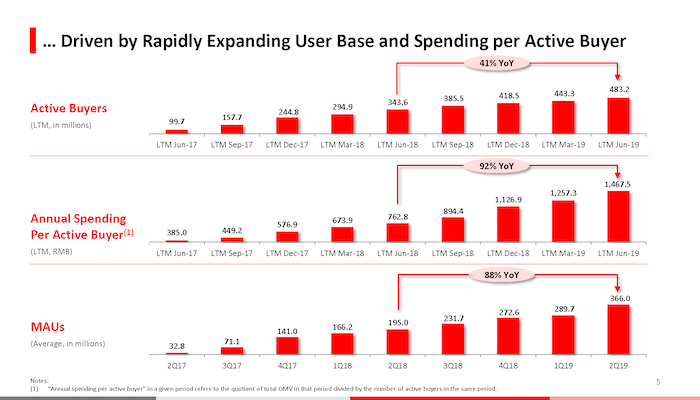
Pinduoduo’s average monthly active users in Q2 2019 reached 366.0 million, an increase of 88% from 195.0 million in Q2 2018. And, its total number of active buyers in the 12-month period ended June 30, 2019 was 483.2 million, an increase of 41% from 343.6 million in the 12-month period ended June 30, 2018.
Compared with other e-commerce platforms in Q2 2019:
The annual spending per active buyer in the twelve-month period ended June 30, 2019 was RMB1,467.5(US$213.8), an increase of 92% from RMB762.8 in the twelve-month period ended June 30, 2018.
Its sales and marketing expenses for the same period grew by 105% year-over-year to RMB6,103.7 million, or 84% of its total revenues.
Pinduoduo Unaudited Financial Results in Q2 2019
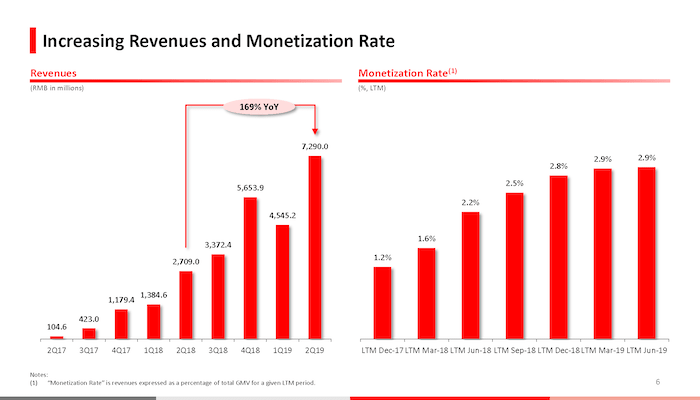
Total revenues were RMB7,290.0 million (US$1,061.9 million), an increase of 169% from RMB2,709.0 million in the same quarter of 2018. The increase was primarily due to an increase in revenues from online marketing services.
- Revenues from online marketing services were RMB6,467.1 million (US$942.0 million), an increase of 173% from RMB2,371.0 million in the same quarter of 2018.
- Revenues from transaction services were RMB822.9 million (US$119.9 million), an increase of 143% from RMB338.1 million in the same quarter of 2018.
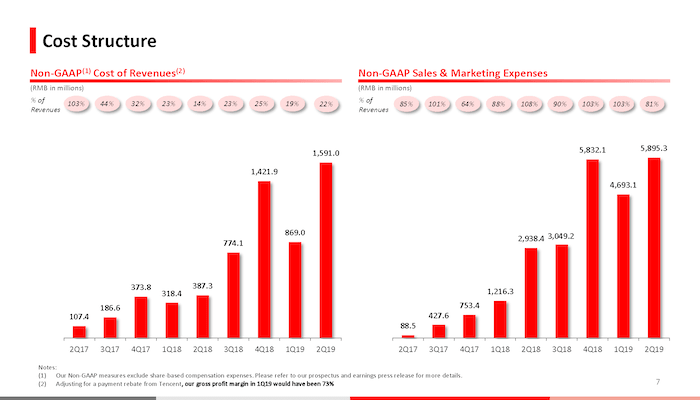
Total costs of revenues were RMB1,594.7 million (US$232.3 million), an increase of 311% from RMB387.8 million in the same quarter of 2018. The increase was mainly due to higher costs for cloud services, call center, and merchant support services.
- Total operating expenses were RMB7,185.7 million (US$1,046.7 million), compared with RMB8,957.4 million in the same quarter of 2018.
- Sales and marketing expenses were RMB6,103.7 million (US$889.1 million), an increase of 105% from RMB2,970.7 million in the same quarter of 2018, mainly due to an increase in online and offline advertisement and promotions.
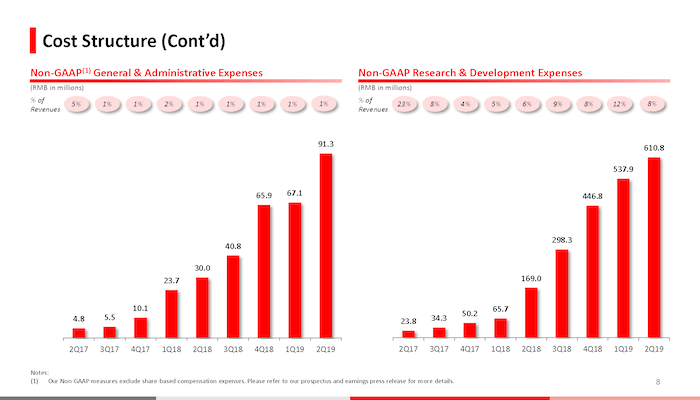
- General and administrative expenses were RMB278.3 million (US$40.5 million), a significant decrease from RMB5,800.7 million in the same quarter of 2018, primarily due to a one-time share-based compensation expense recorded in April, 2018.
- Research and development expenses were RMB803.7 million (US$117.1 million), an increase of 332% from RMB186.0 million in the same quarter of 2018. The increase was primarily due to an increase in headcount and the recruitment of more experienced R&D personnel, and an increase in R&D-related cloud services expenses and share-based compensation expenses.
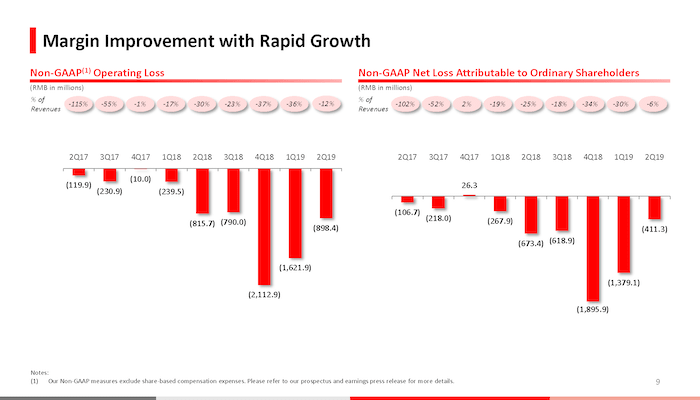
Operating loss was RMB1,490.4 million (US$217.1 million), compared with operating loss of RMB6,636.2 million in the same quarter of 2018. Non-GAAP operating loss6 was RMB898.4 million (US$130.9 million), compared with RMB815.7 million in the same quarter of 2018.
Net loss attributable to ordinary shareholders was RMB1,003.3 million (US$146.1 million), compared with a net loss of RMB6,493.9 million in the same quarter of 2018. Non-GAAP net loss attributable to ordinary shareholders7 was RMB411.3 million (US$59.9 million), compared with a non-GAAP net loss attributable to ordinary shareholders of RMB673.4 million in the same quarter of 2018.
Basic and diluted net loss per ADS were RMB0.88(US$0.12), compared with a net loss per ADS of RMB13.40 in the same quarter of 2018. Non-GAAP basic and diluted net loss per ADS were RMB0.36(US$0.04), compared with non-GAAP basic and diluted net loss per ADS of RMB1.40 in the same quarter of 2018.
Net cash provided by operating activities was RMB4,148.0 million (US$604.2 million), compared with RMB1,087.6 million in the same quarter of 2018, primarily due to an increase in online marketing services revenues.
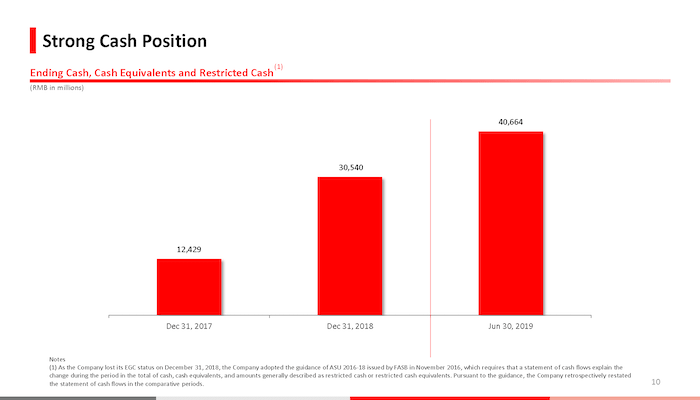
Cash, cash equivalents and restricted cash were RMB40.7 billion (US$5.9 billion) as of June 30, 2019, compared with RMB30.5 billion as of December 31, 2018.